> ## Documentation Index
> Fetch the complete documentation index at: https://data.avert.ldeo.columbia.edu/llms.txt
> Use this file to discover all available pages before exploring further.

# Instruments

> Magnetic field data

We are using Mag-13 three-axis fluxgate magnetometers manufactured by Bartington Instruments. For more information, please see the [Bartington Instruments webpage](https://www.bartington.com/products/high-performance-magnetometers/mag-13-three-axis/). The voltage signals output by the sensing coils in this instrument are digitised using the 24-bit Nanometrics Centaur datalogger, which we also use to digitise the signals from our analogue seismometers.
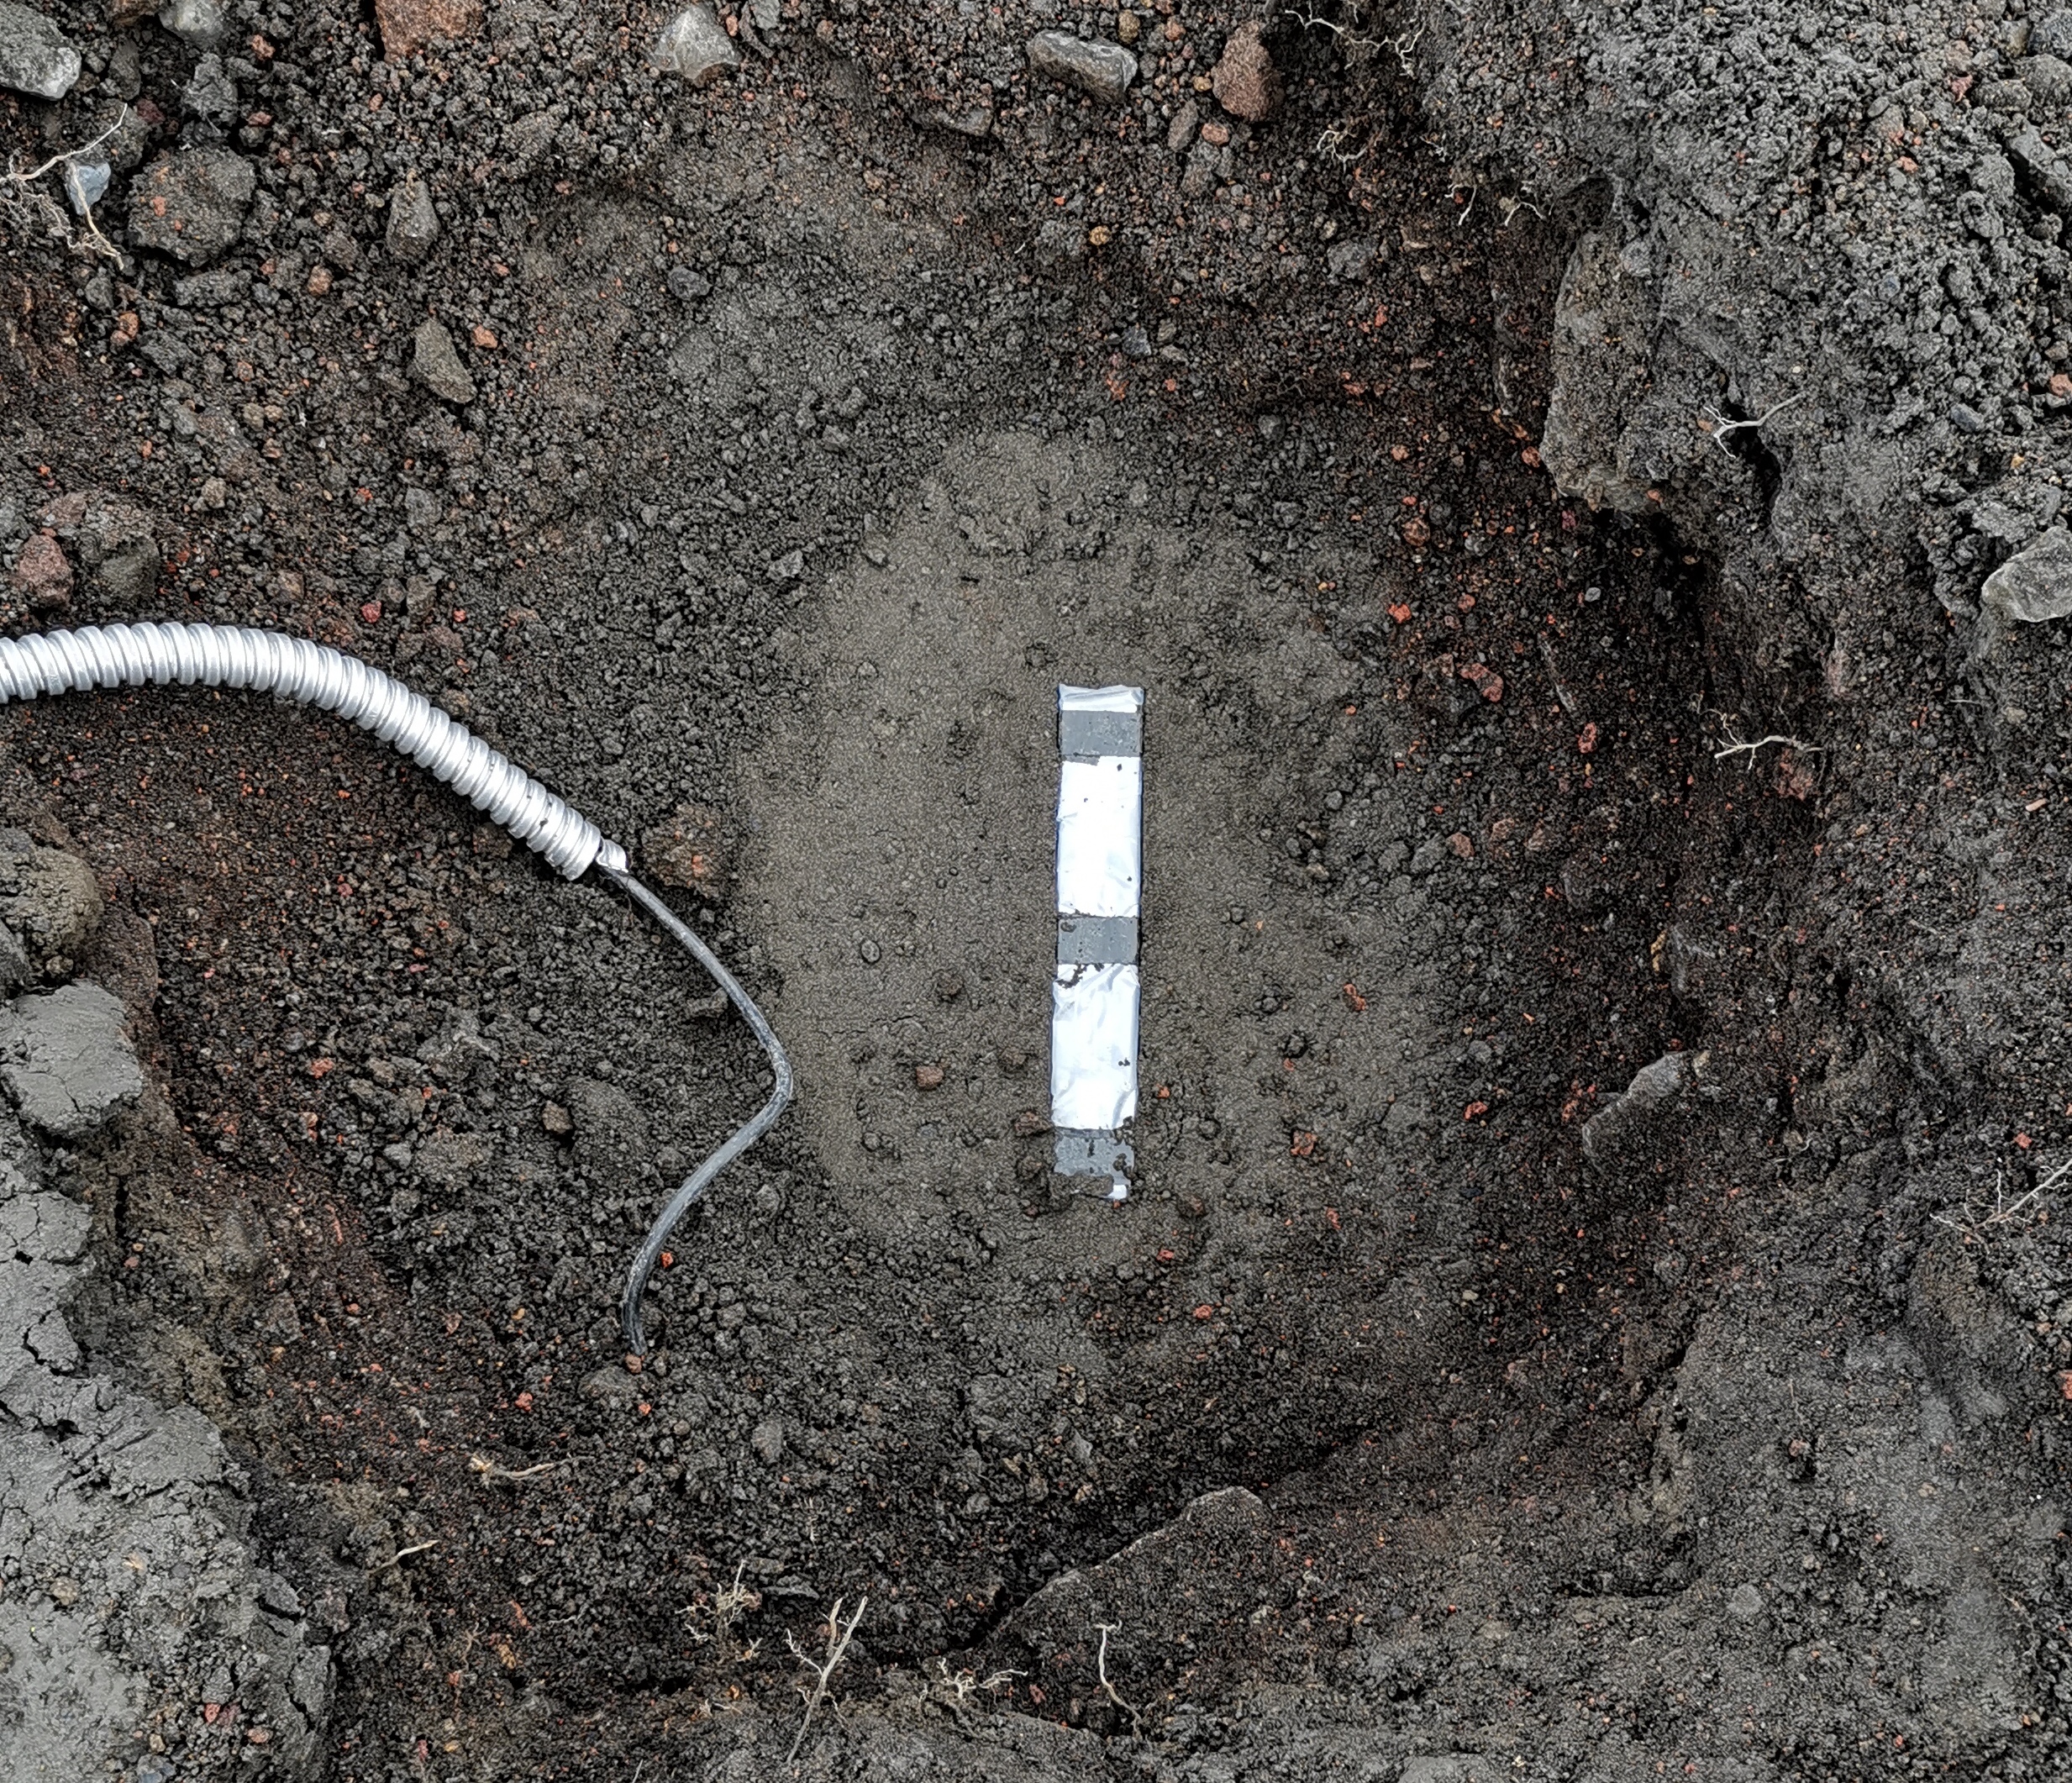
<Frame caption="A top-down picture of one of our fluxgate magnetometers in the ground at Okmok volcano, in the Aleutians. This device, approximately 25 cm in length, contains 3 orthogonal fluxgate magnetometers that continuously measure the orientation and magnitude of the local magnetic field.">
  <img src="https://avert-legacy.ldeo.columbia.edu/magnetometry/static/img/magnetometer.jpg" alt="A top-down picture of one of our fluxgate magnetometers in the ground at Okmok volcano, in the Aleutians. This device, approximately 25 cm in length, contains 3 orthogonal fluxgate magnetometers that continuously measure the orientation and magnitude of the local magnetic field." height="400" className="rounded-lg" />
</Frame>

## Example data plots

Some sample data from the AV.OKBR magnetometer, deployed inside the Okmok caldera, are shown below.
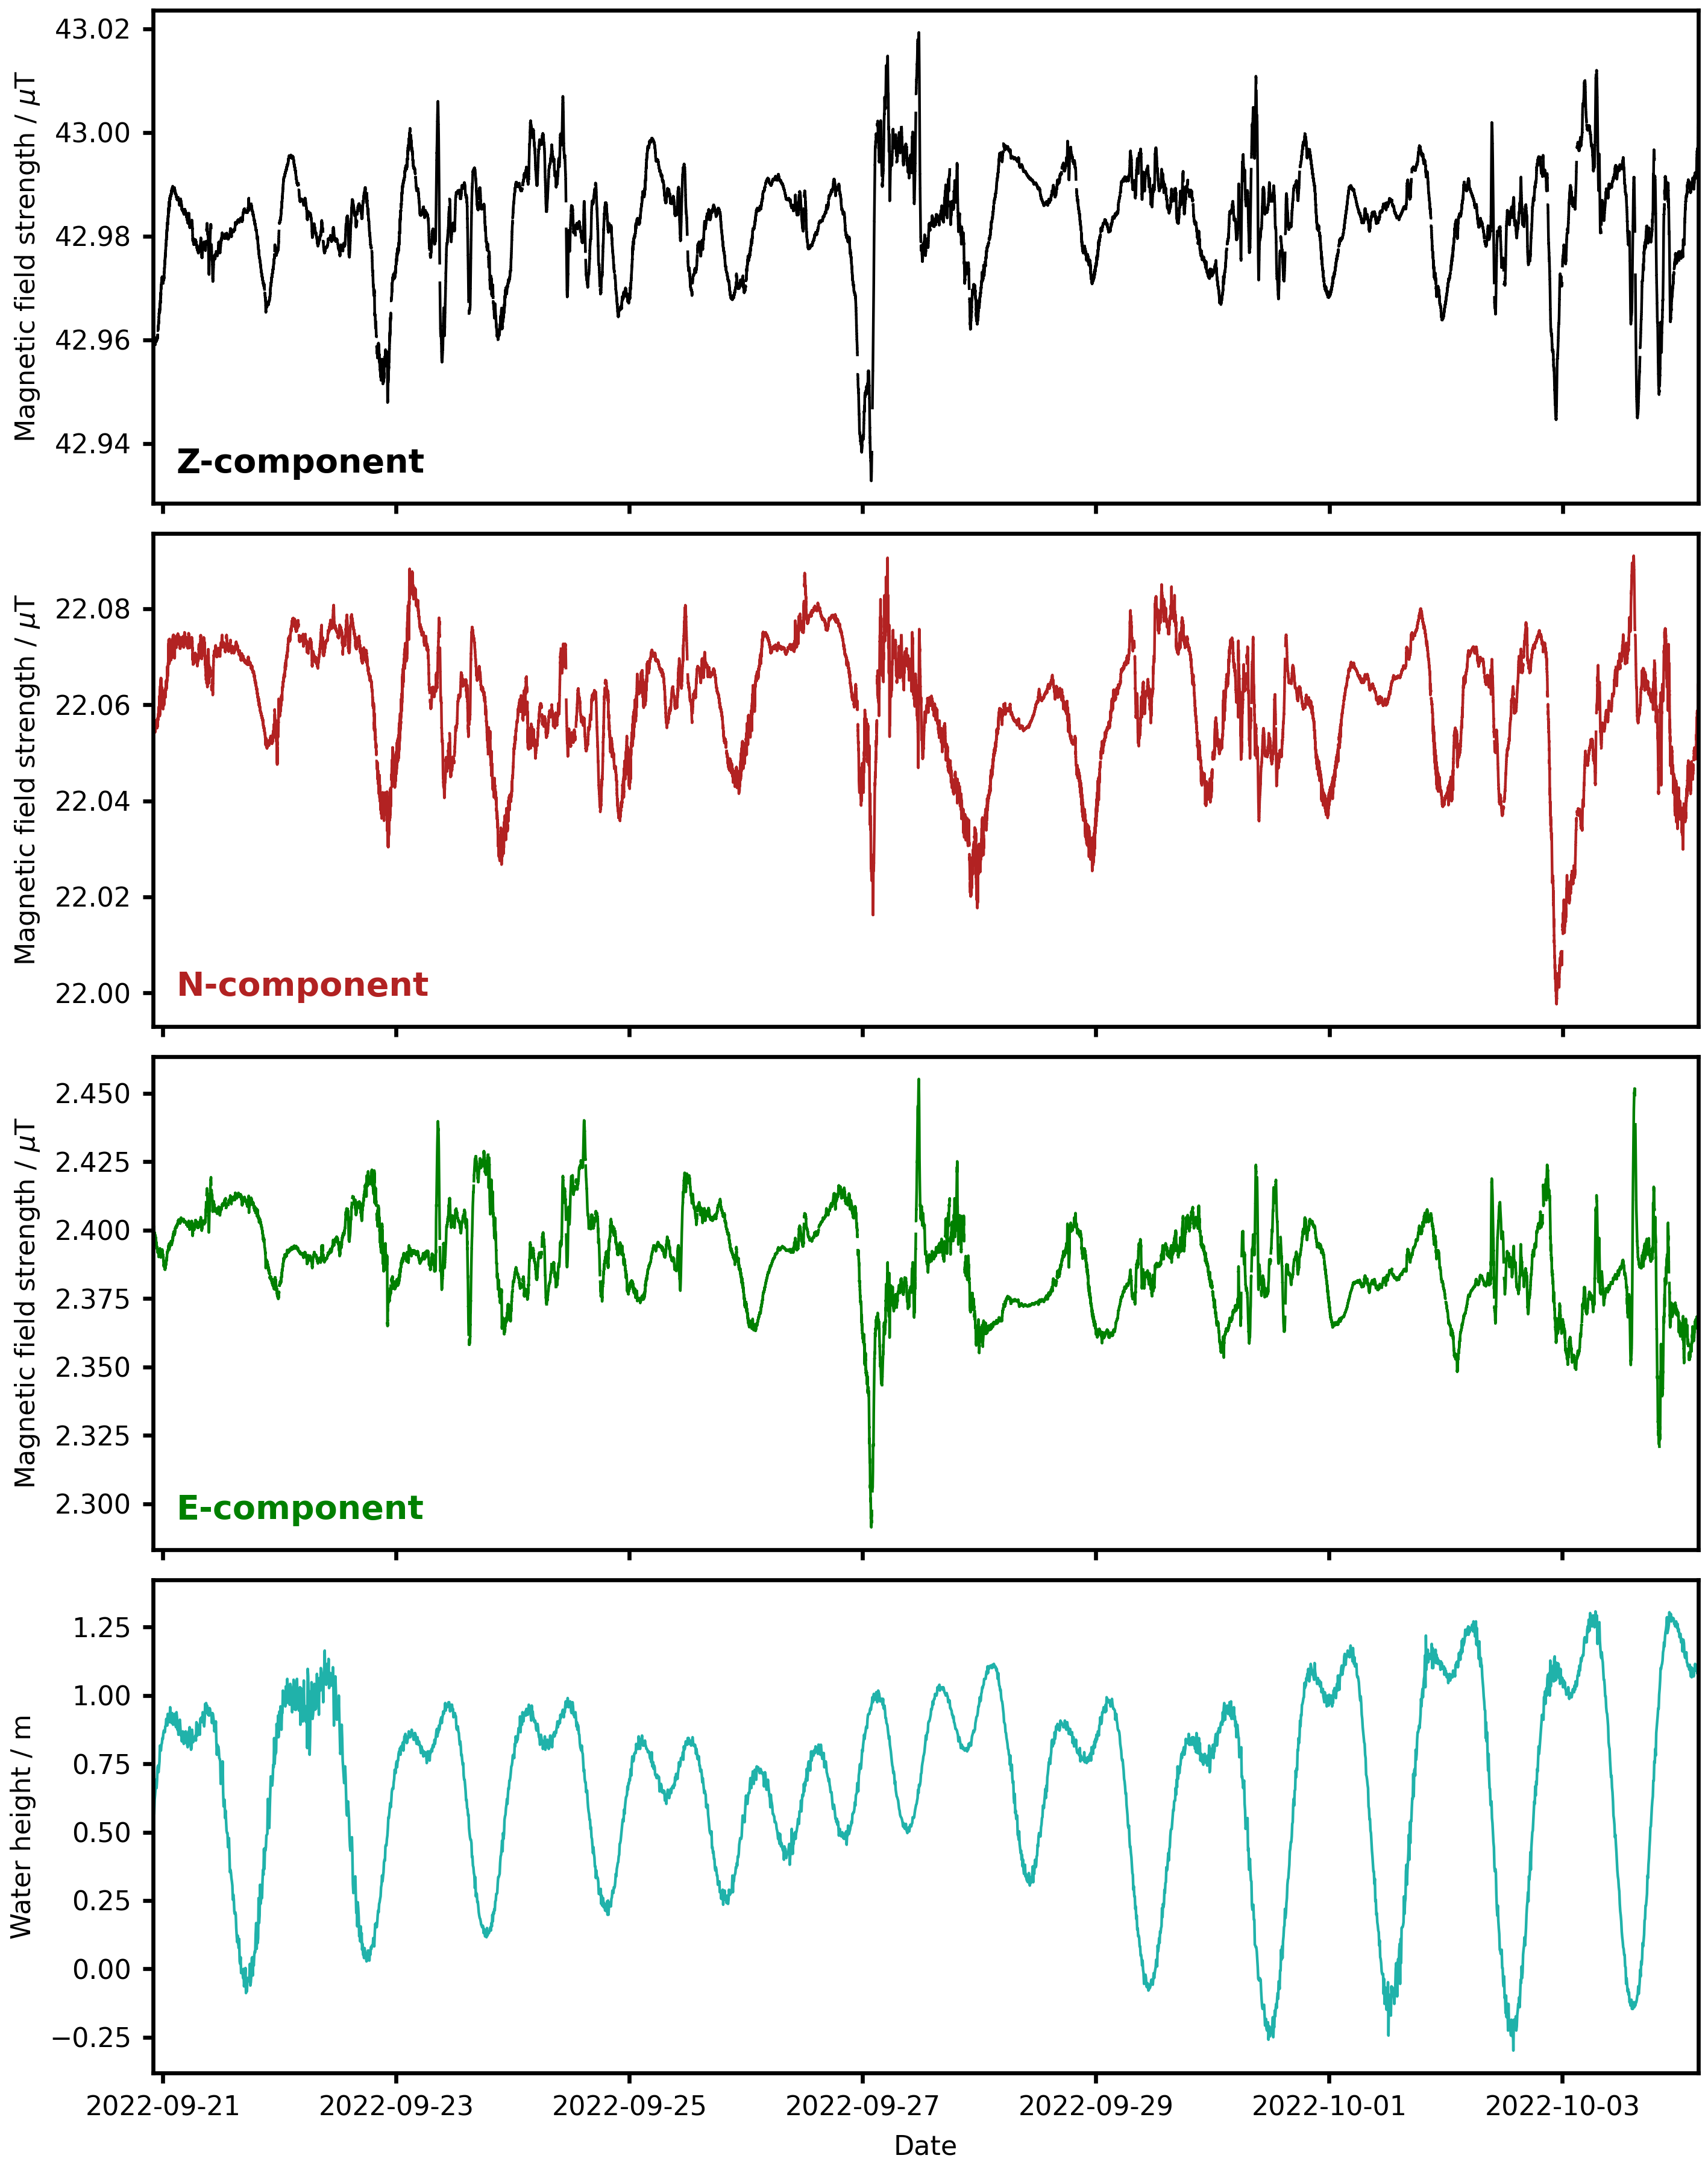
<Frame caption="An example snapshot of the vertical component of the magnetic field, recorded at the station OKBR, on Okmok. The data show variations on a period of approximately a day, as well as short-term variations likely related to changes in activity in the ionosphere/magnetosphere and, hopefully, the signals we are interested in!">
  <img src="https://avert-legacy.ldeo.columbia.edu/magnetometry/static/img/magnetic_field_data.png" alt="An example snapshot of the vertical component of the magnetic field, recorded at the station OKBR, on Okmok. The data show variations on a period of approximately a day, as well as short-term variations likely related to changes in activity in the ionosphere/magnetosphere and, hopefully, the signals we are interested in!" height="400" className="rounded-lg" />
</Frame>
